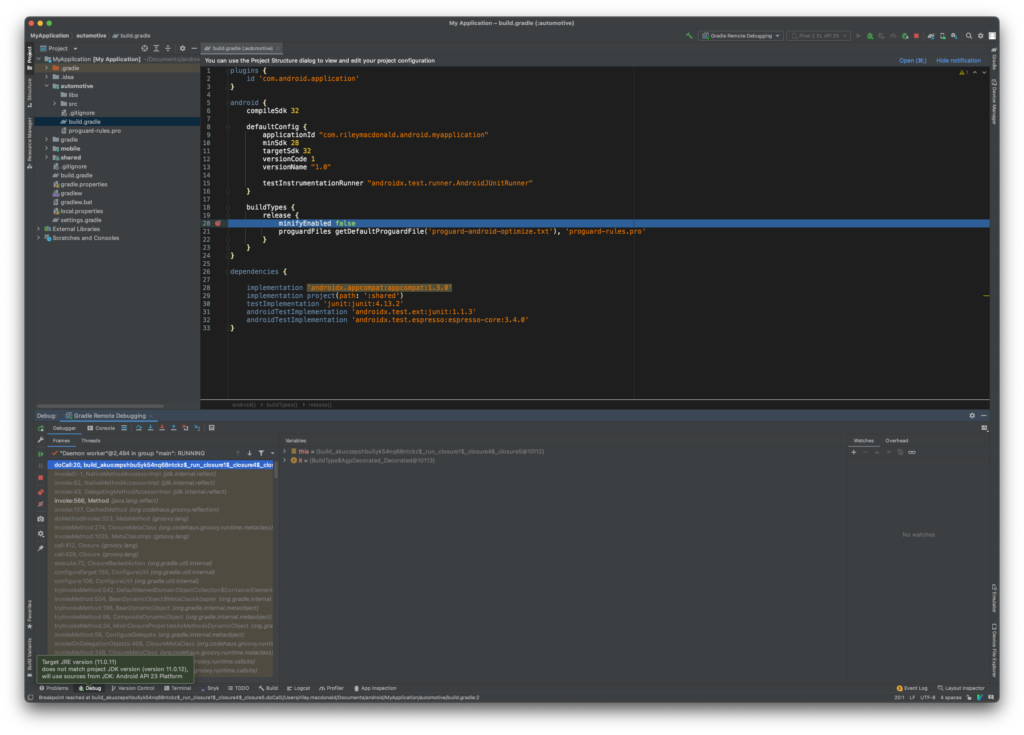
This post explains how to debug Gradle scripts using Android Studio, enabling the use of live breakpoints, stepping and evaluations.
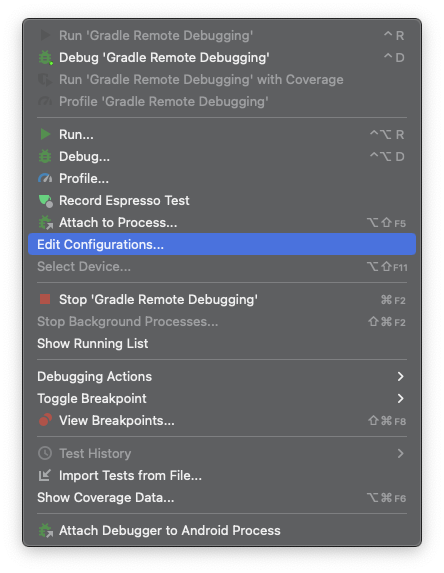
Create a new Run/Debug Configuration from the Android Studio menu (Run -> Edit Configurations).
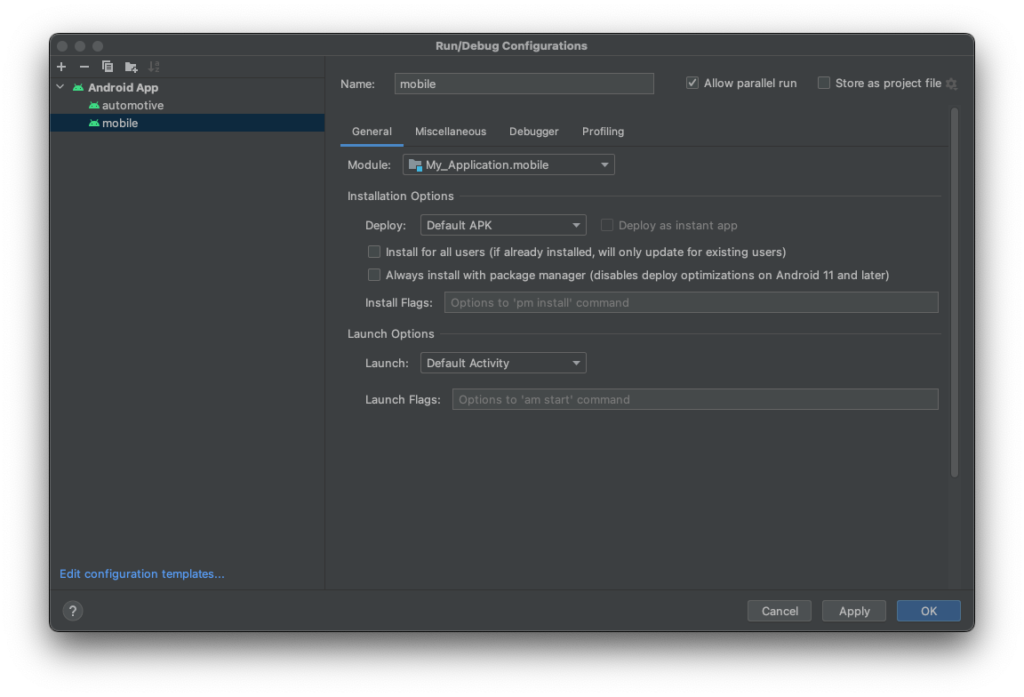
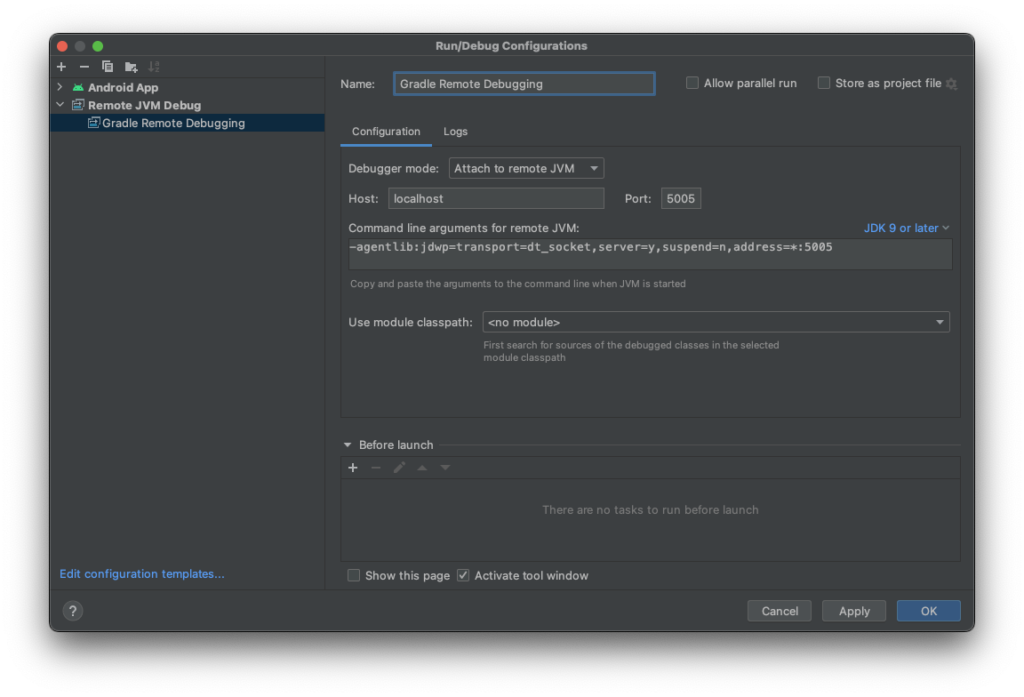
From the Run/Debug Configuration dialog, press the + button to create a new run/debug configuration.
Choose “Remote JVM Debug”
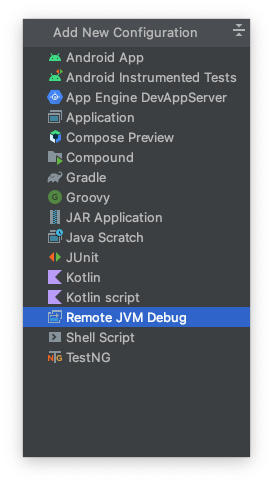
Provide a name, such as “Gradle Remote Debugging”. The default provided values should be adequate.
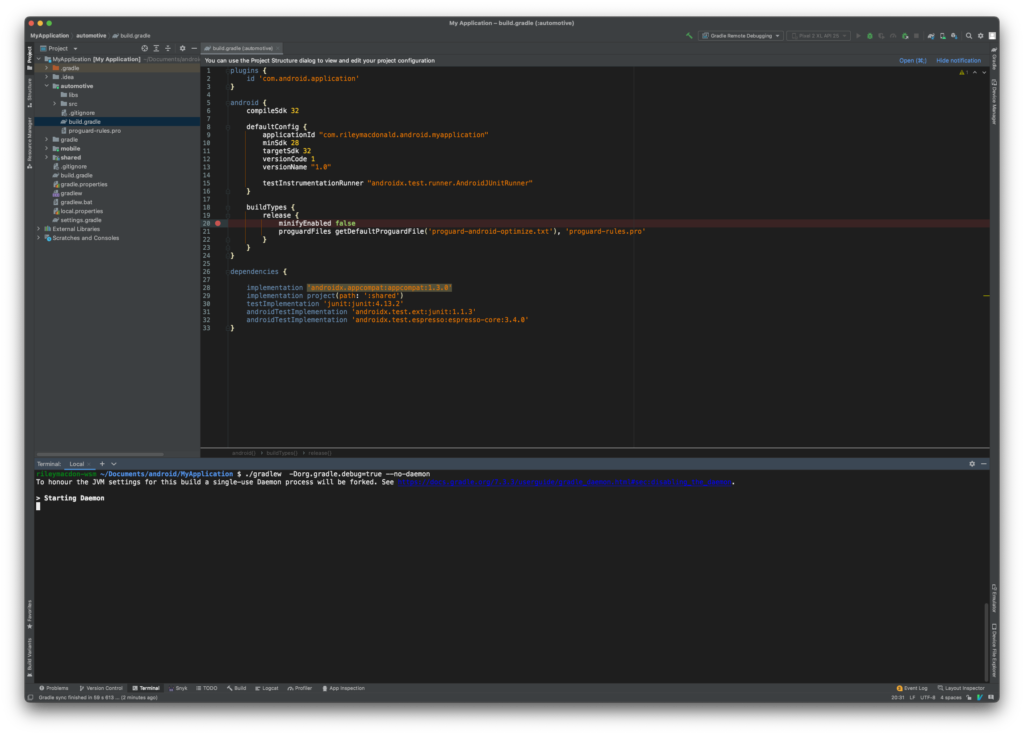
Run the Gradle task or command which will execute the script or code you’re looking to debug. The following argument must be included with the Gradle command -Dorg.gradle.debug=true --no-daemon
Run the Gradle command from Android Studios terminal (or your preferred terminal). The Gradle daemon will await a connection from the debugger.
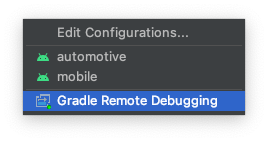
Ensure you have a breakpoint set within the Gradle script you’re attempting to debug. From the runtime configuration selector, select the new Remote JVM Debug configuration created above. Press the debug button.
The awaiting daemon will begin to run, Android Studio should now be attached and stop on any breakpoints set within the Gradle script. If your breakpoints aren’t working, ensure the correct Gradle task/command was executed for the script being debugged.
You should now be able to step, debug and evaluate expressions within your Gradle scripts.